How can DIY street traffic counts be used to improve communities?
The DIY Traffic Counter is a low-cost, open-source measurement device that allows anyone to accurately measure and visualize street traffic counts. An individual or community group can use it to measure automobiles or bicycles traveling along a street in order to get a better understanding of how traffic is flowing on that street, then plan street design and transportation management accordingly. There are three steps to the process: BUILD, DEPLOY, INTERPRET.
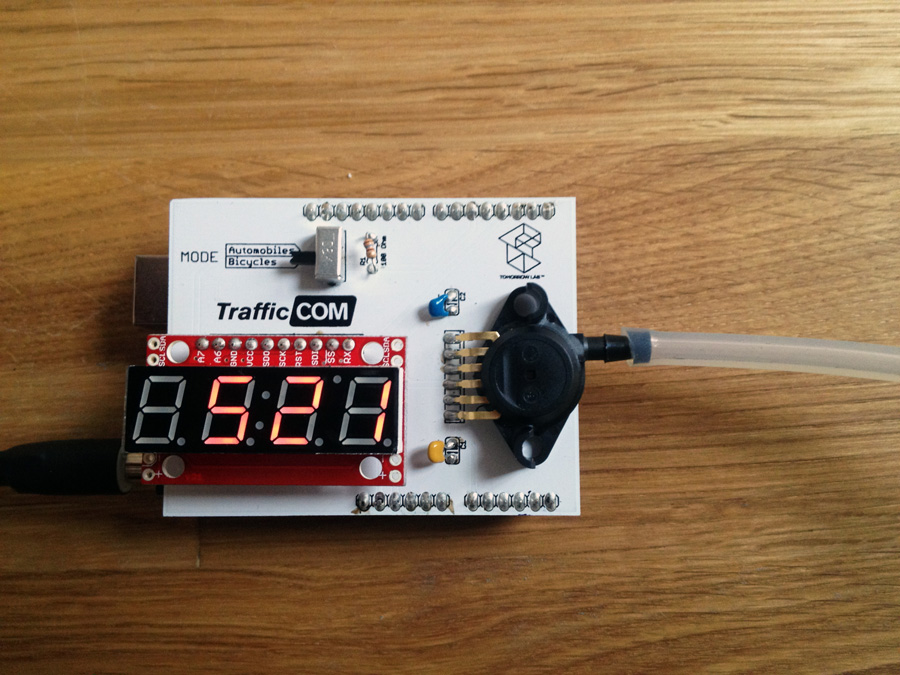
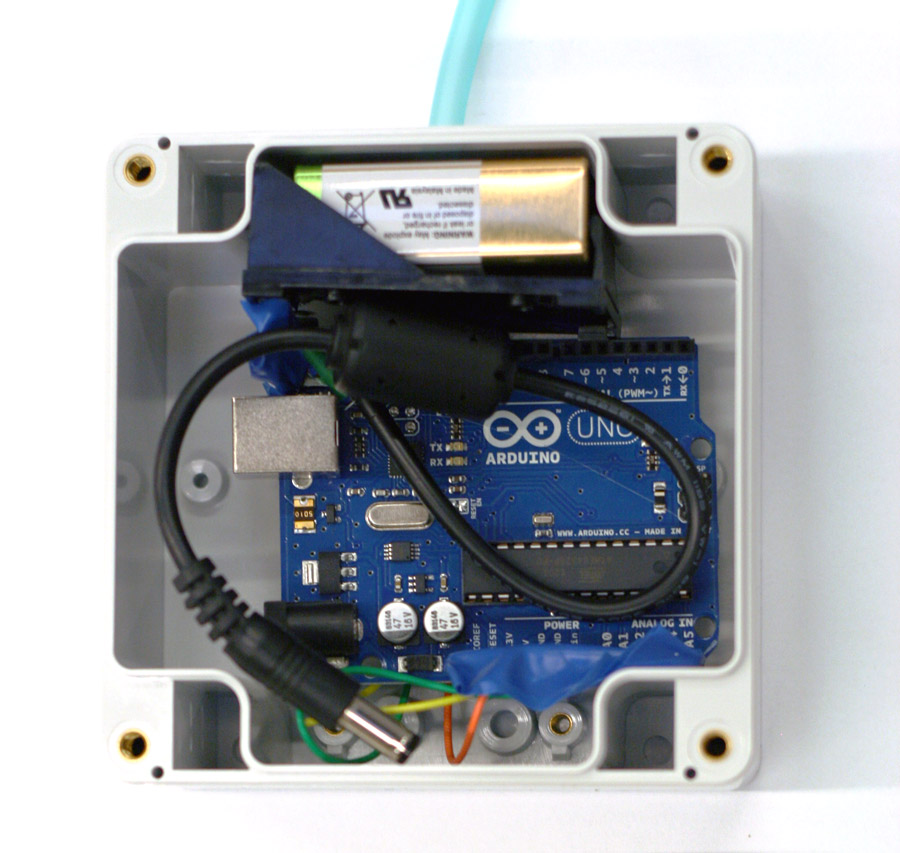
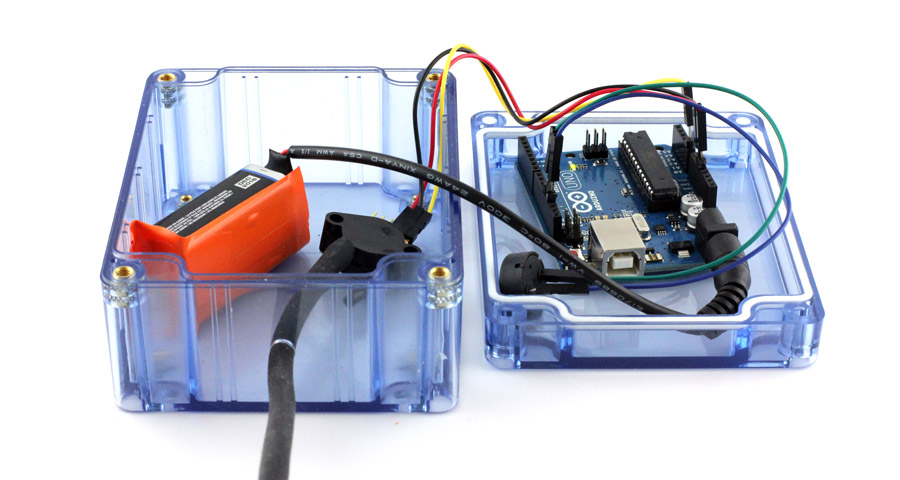
1) BUILD - The device is battery-powered and made from about $80 in parts available from the internet. The ‘brain’ of the device is an Arduino, the popular open-source prototyping platform. The hose is made from aquarium air-line tubing. We have made the parts list and Arduino code available under a Creative Commons License. We have developed multilingual How-To guides to allow anyone to build a DIY Traffic Counter.
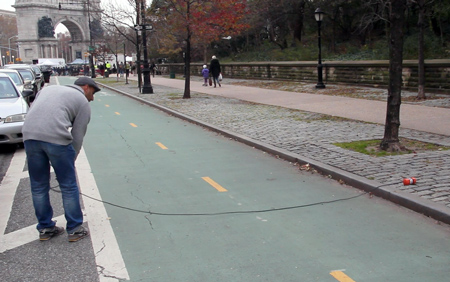
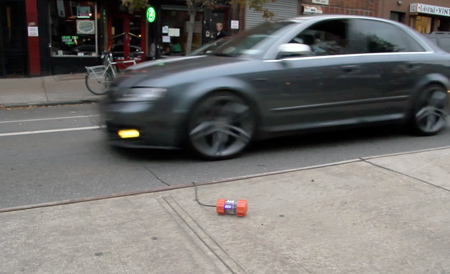
2) DEPLOY - Setup the device in a secure area and lay the tube across 1-2 lanes of car traffic or bike traffic. Power-up the device to accurately measure the Traffic Count (volume), Traffic Rate (cars/minute), Average speed (mi/hour). The data is recorded in the device’s onboard memory. Each 9V battery allows about 8 hours of measurement. Use larger batteries for longer measurement periods.
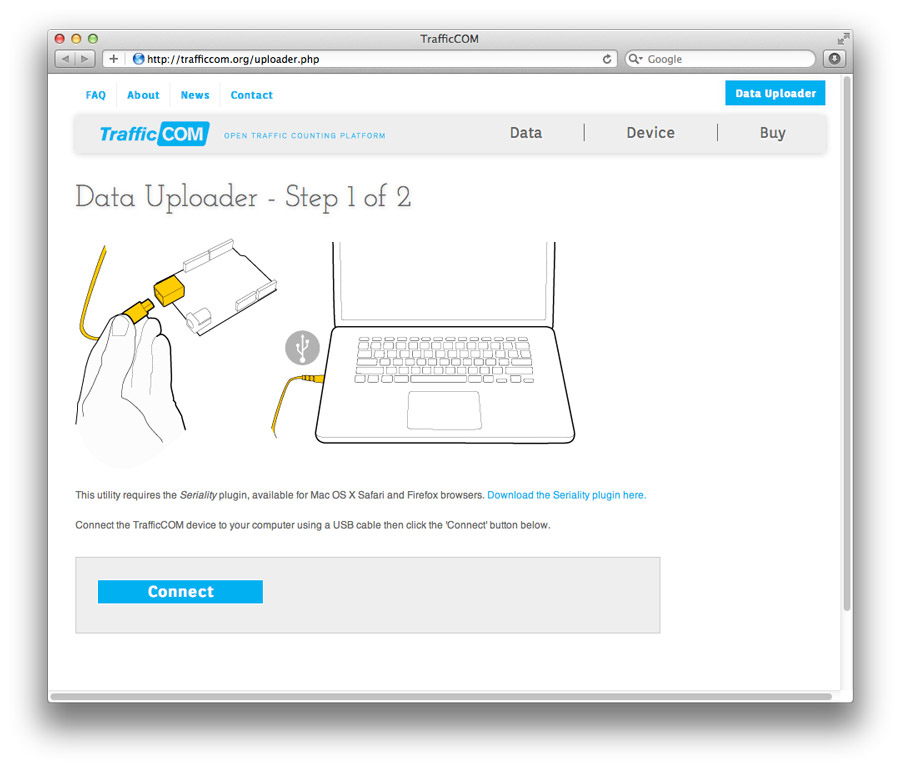
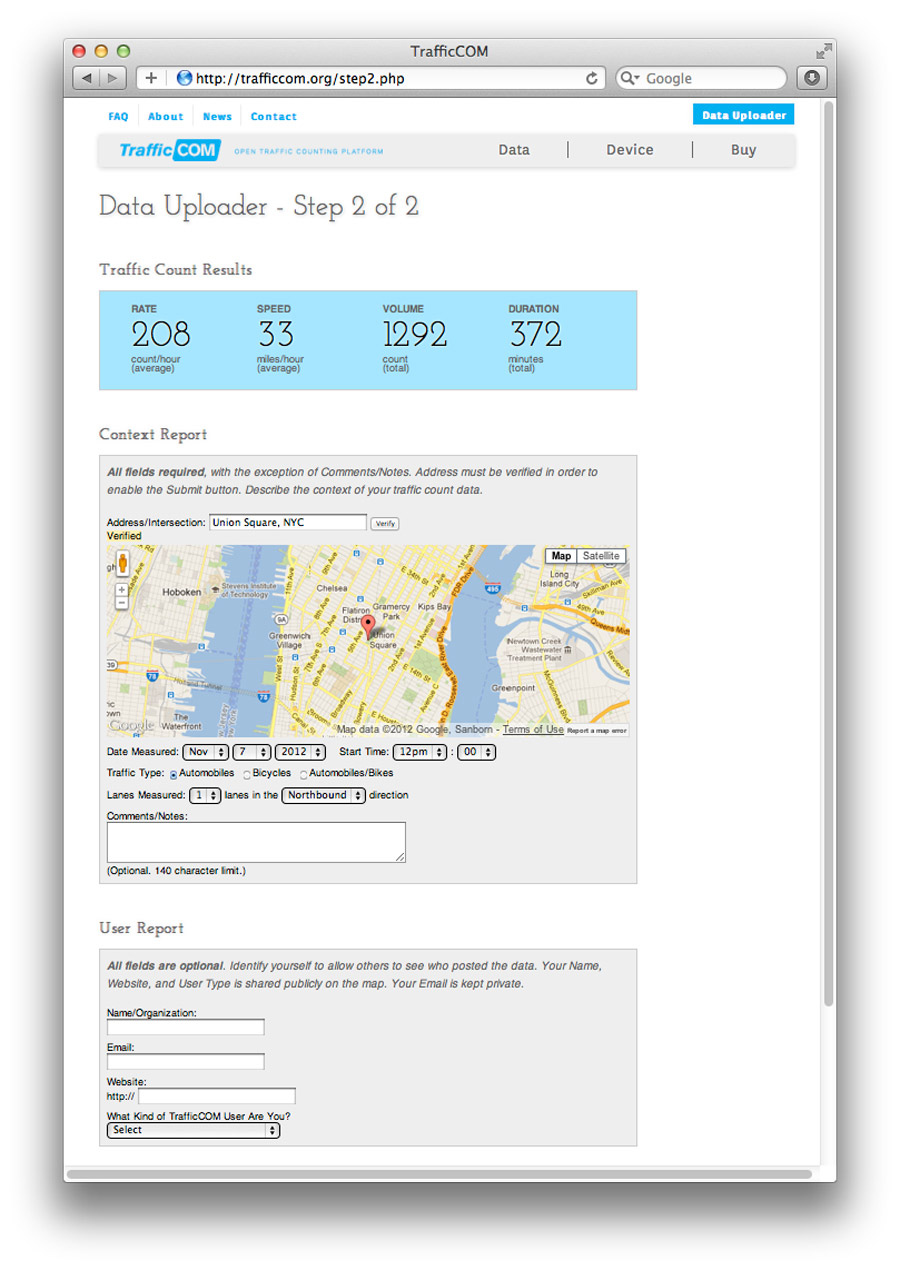
3) INTERPRET - Bring the device back to your lab and connect to a computer to retrieve the stored data. With a few keystrokes using the Arduino software, you are presented with a table of the stored information. Understand the data using our How-To guides and use online data mapping tools to help visualize and share the data. Then, act appropriately!
Traffic count information is currently gathered and communicated in a manner that can be difficult to understand for community members or other non-transportation professionals. We seek to reverse this problem by creating a platform where data can be gathered and visualized by anyone, thus giving anyone a voice in the planning and design process of their transportation system. This information can also support government initiatives by filling holes in municipal data collection efforts.
The information collected by the traffic counter is commonly known as Annual Average Daily Traffic (AADT) or Average Daily Traffic (ADT). This indicator is an important measurement in planning, designing, and managing transportation systems. For example: if your street’s traffic rate is considered ‘low-volume’, it can be considered acceptable to change one car traffic lane into bicycle-use only. Of course there are other factors that need to be taken into account, but traffic count information is an important baseline for re-allocating street space.
Raw data and data-visualizations from the DIY Traffic Counter can be used to do the following:
As more people use the device, we can collectively build rich data-visualizations of local traffic count information for anywhere in the world using online mapping platforms like Google Maps and CartDB.com. Such maps allow constant comparison and visualization of traffic count information. For example, information can be displayed that compares rush-hour and non-rush hour traffic, and weekday vs. weekend traffic counts, just to name a few.
Advocates for safer streets and more efficient transportation systems are constantly looking for new ways to collect accurate real-time information regarding transportation networks. We believe this tool can help them.
Software Programming
Link to BOM & Arduino Code

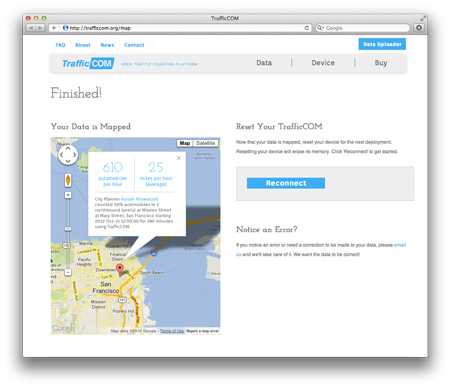
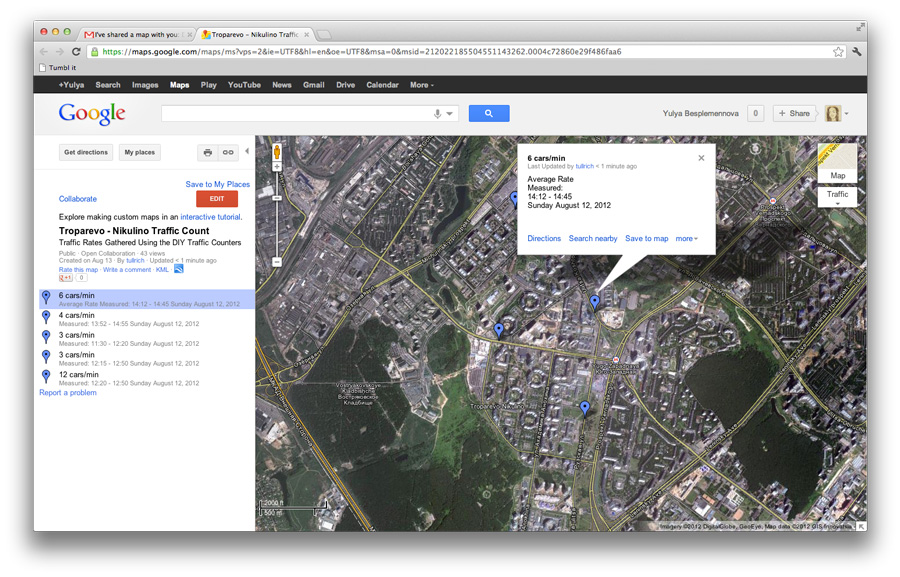 Posting the results online using Google Maps, CartoDB.com, or another open data mapping platform, allows yourself and others to visualize and learn from the results. What can community groups around the world do with this data? How can local community groups and city planners work together to plan better streets? The larger vision is to create an open, online repository of traffic counts for everyone's benefit.
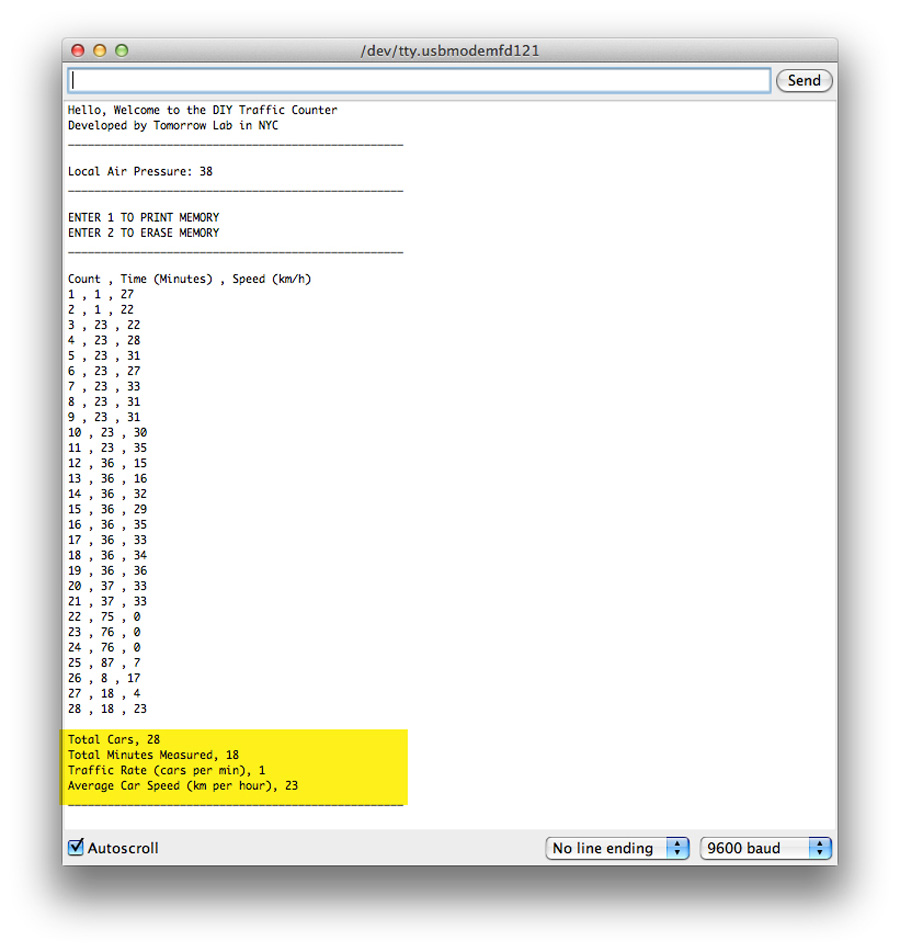 When connected to a computer, you can access the memory of the unit to retrieve the raw recorded data and digested insights including Total Cars/Bikes, Total Minutes Measured, Average Cars/Bikes per Minute, and Average Speed.
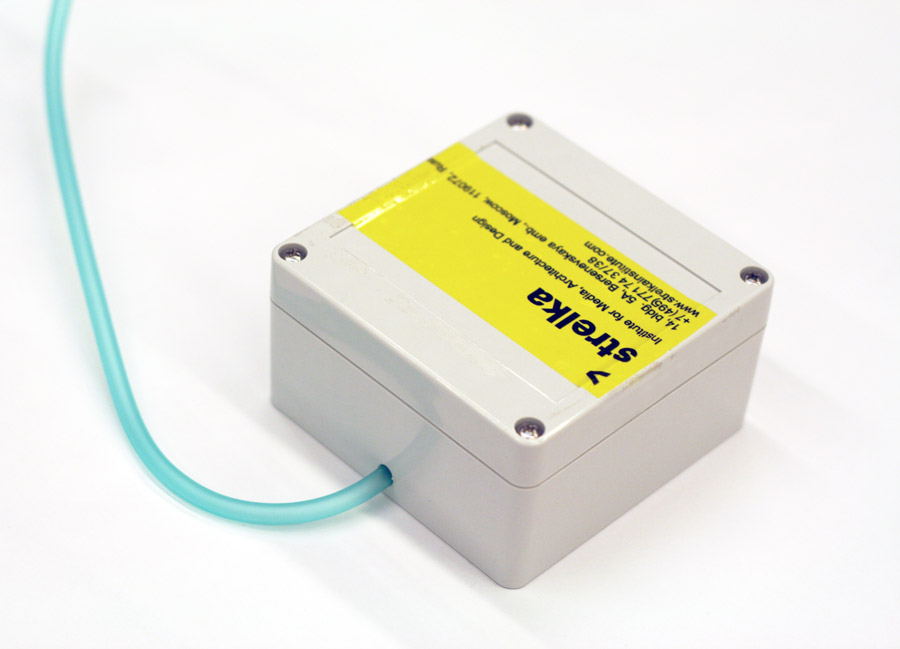
 Version 2. Built in Moscow, Russia at STRELKA Institute.
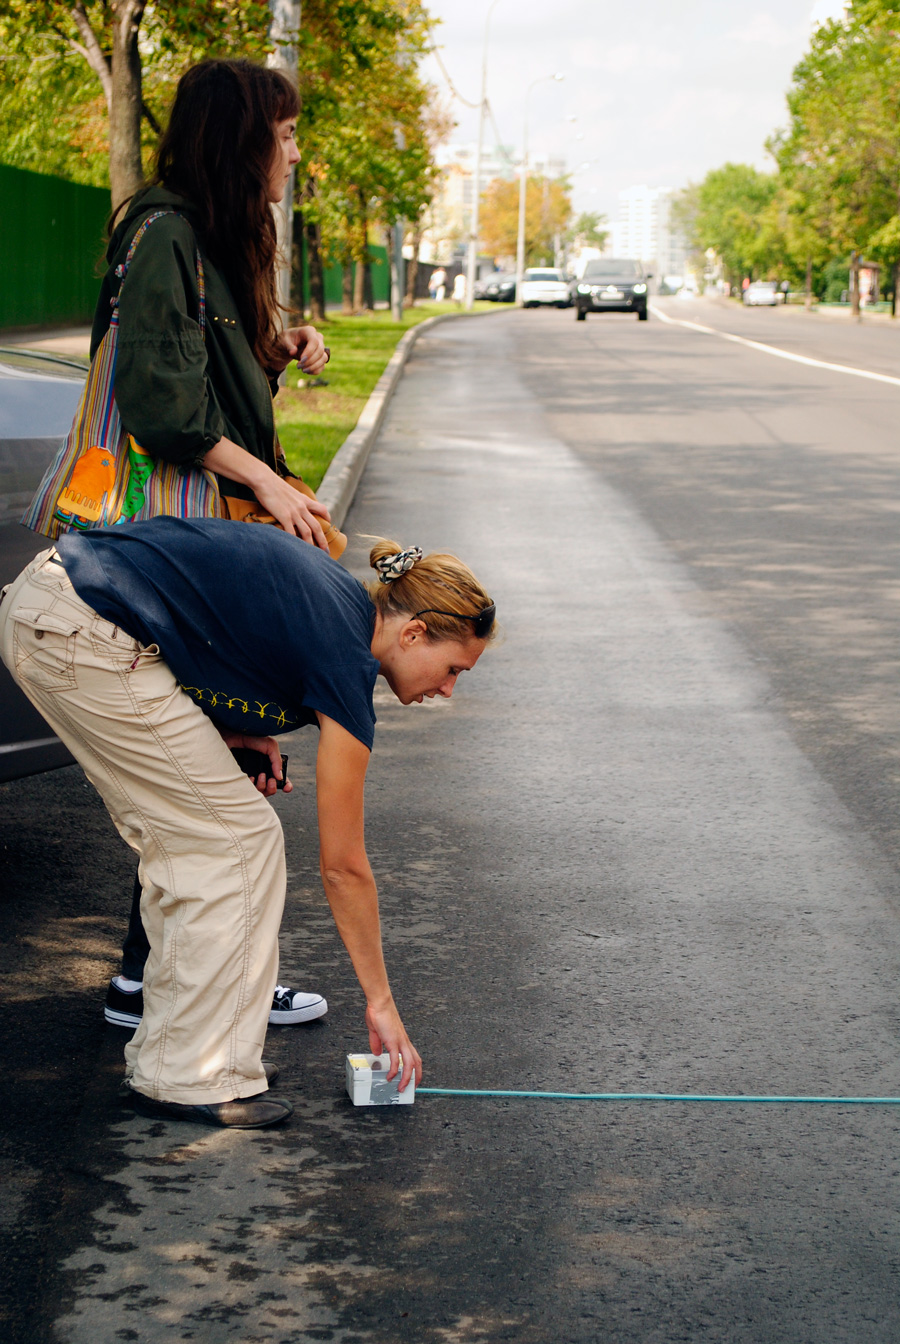
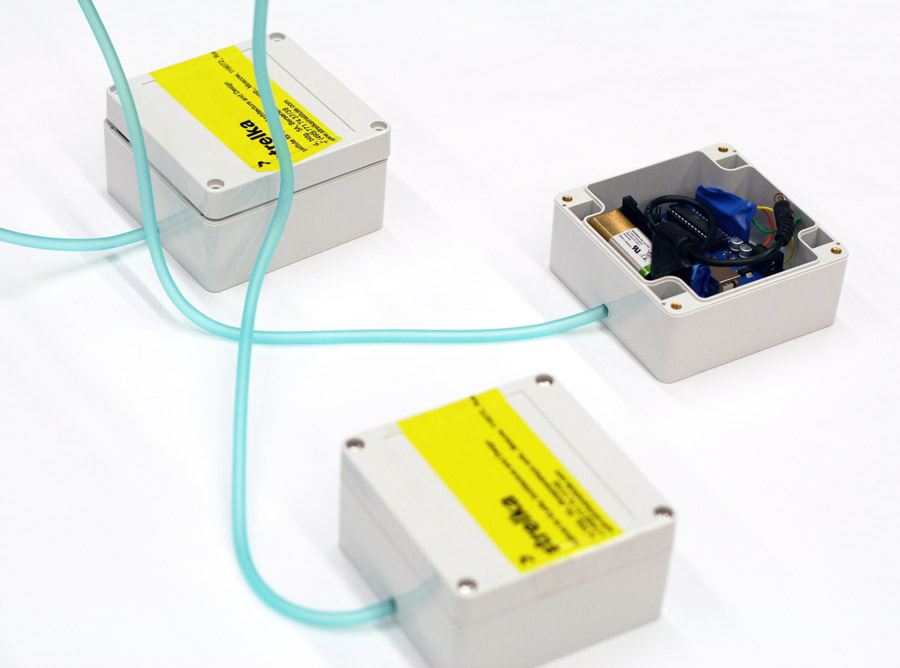
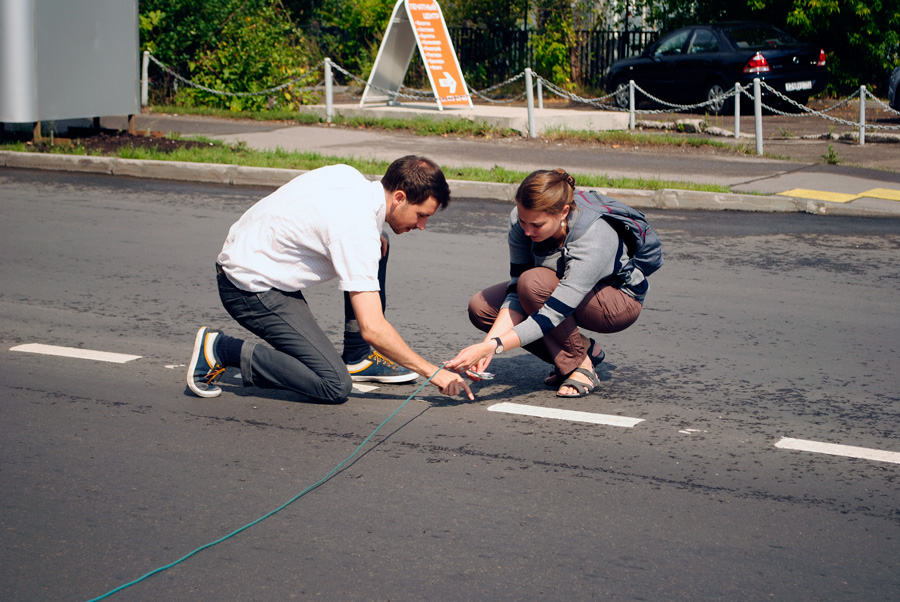 Devices were built and deployed in Moscow, Russia with a workshop group at STRELKA Institute in order to measure car traffic in a neighborhood's streets.
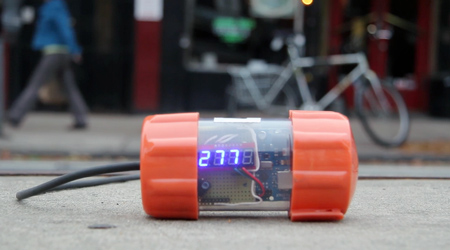
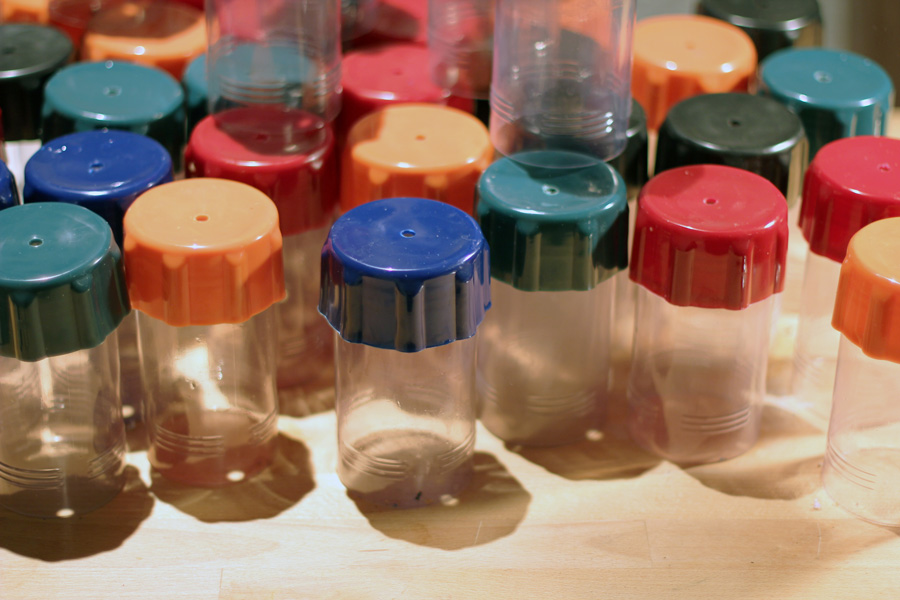
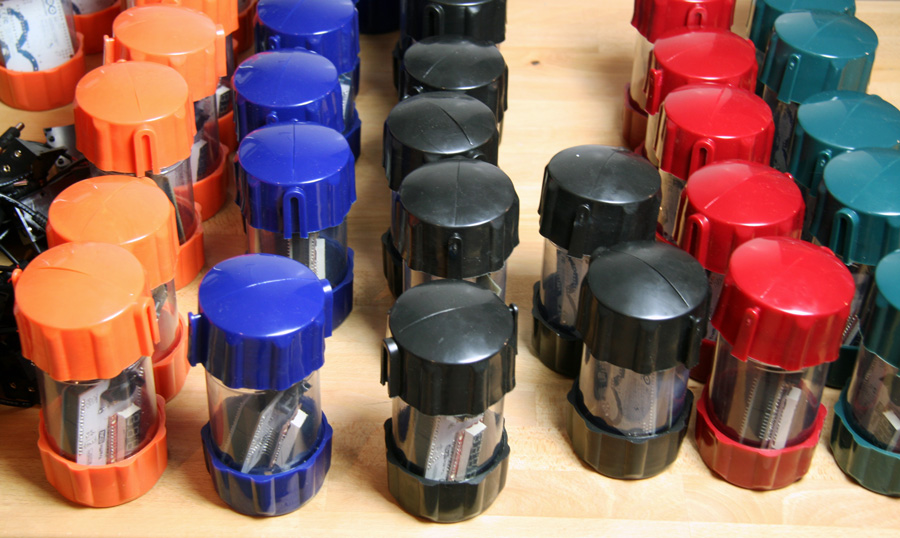
 Version 3. Built for the UP Urban Prototyping Festival in San Francisco.
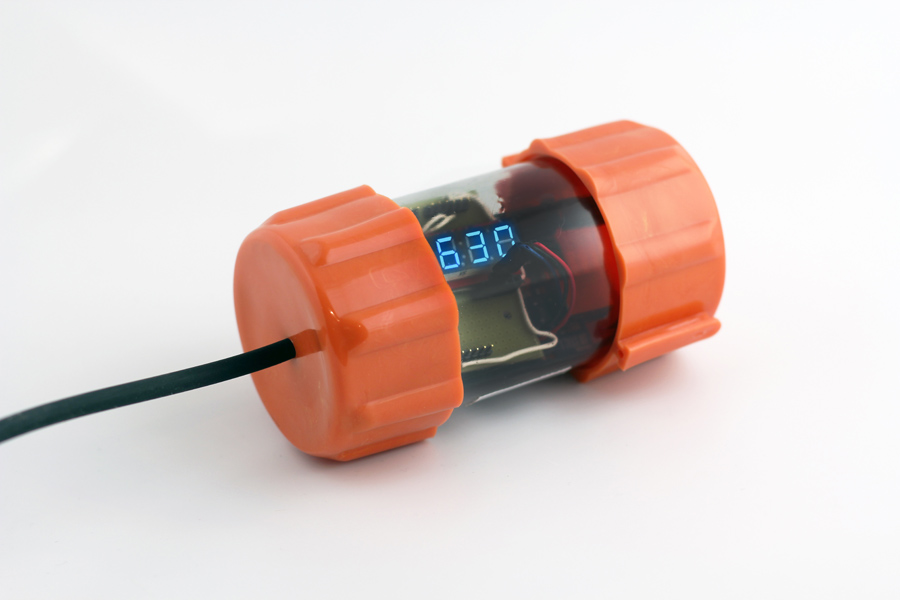
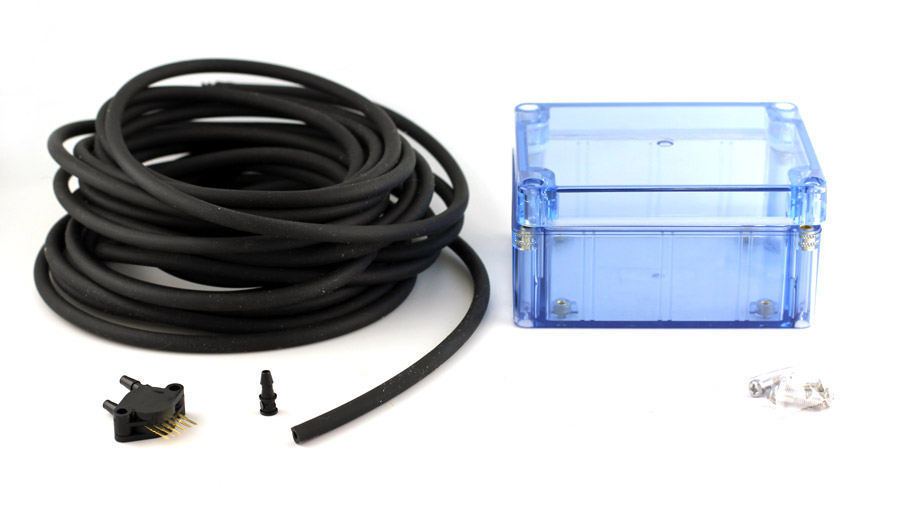 Mechanical Components.
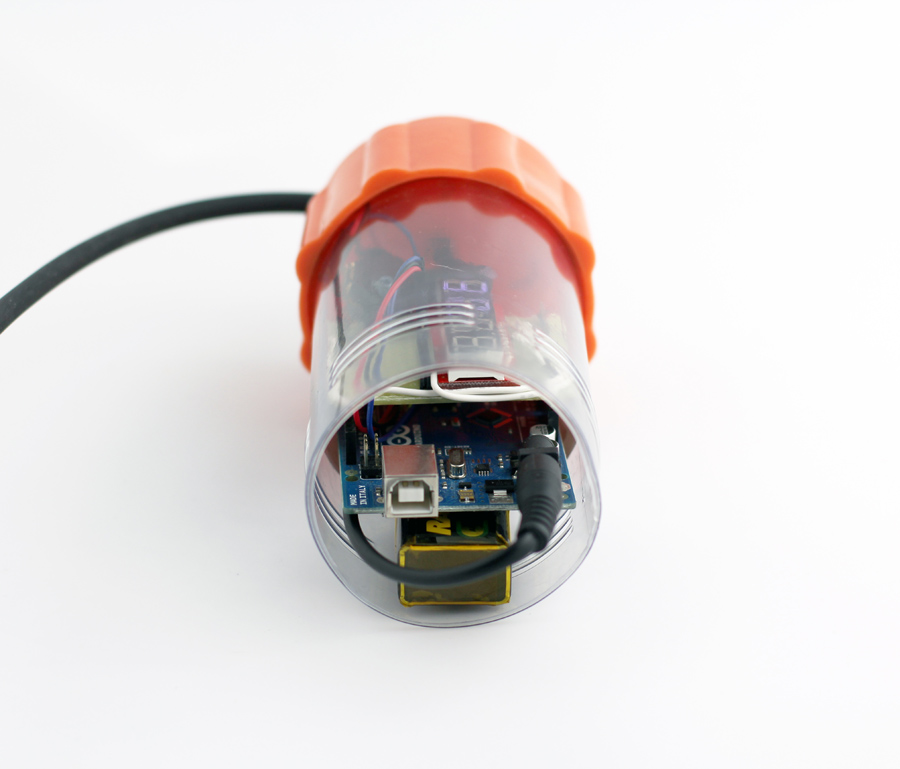
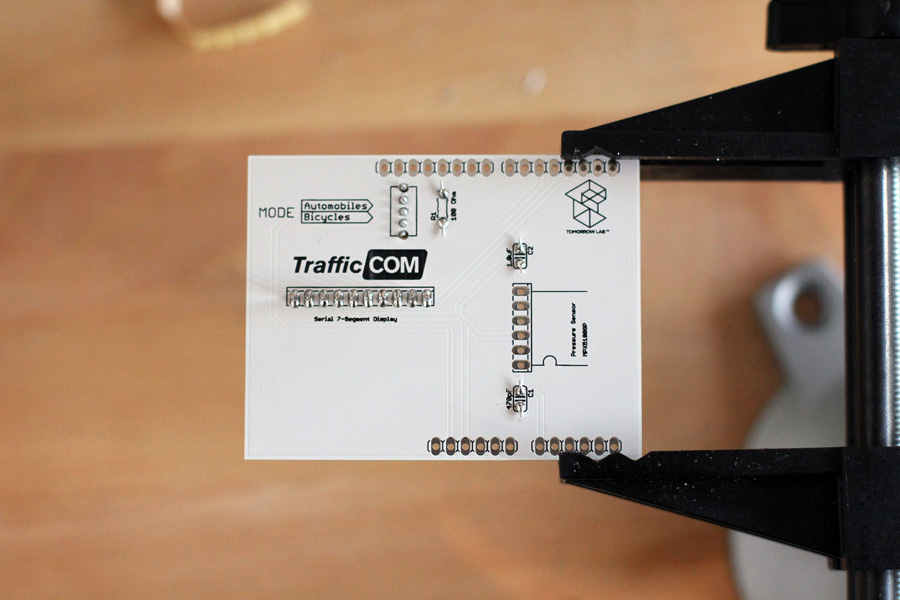
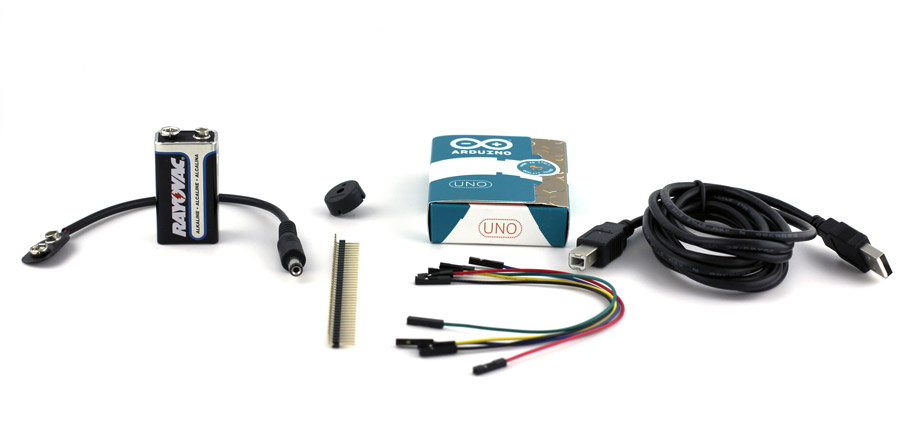 Electrical Components.
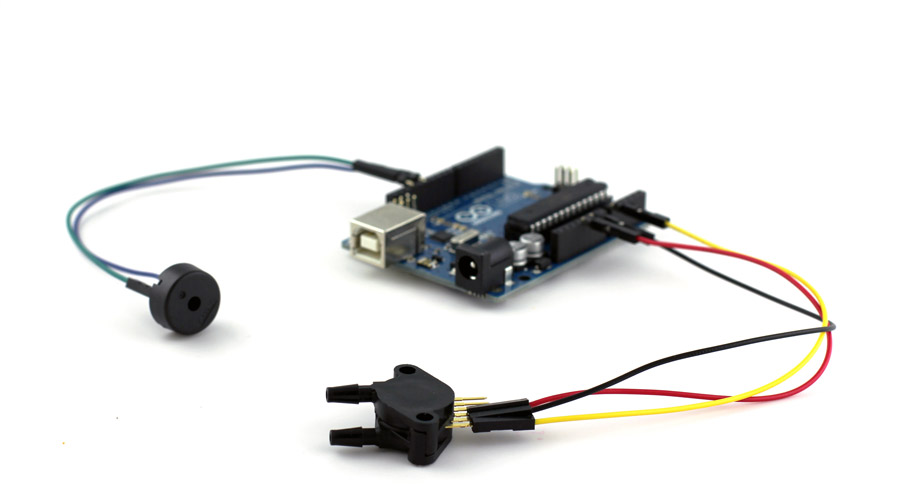 Simple components: a Buzzer and a Differential Air Pressure Sensor.
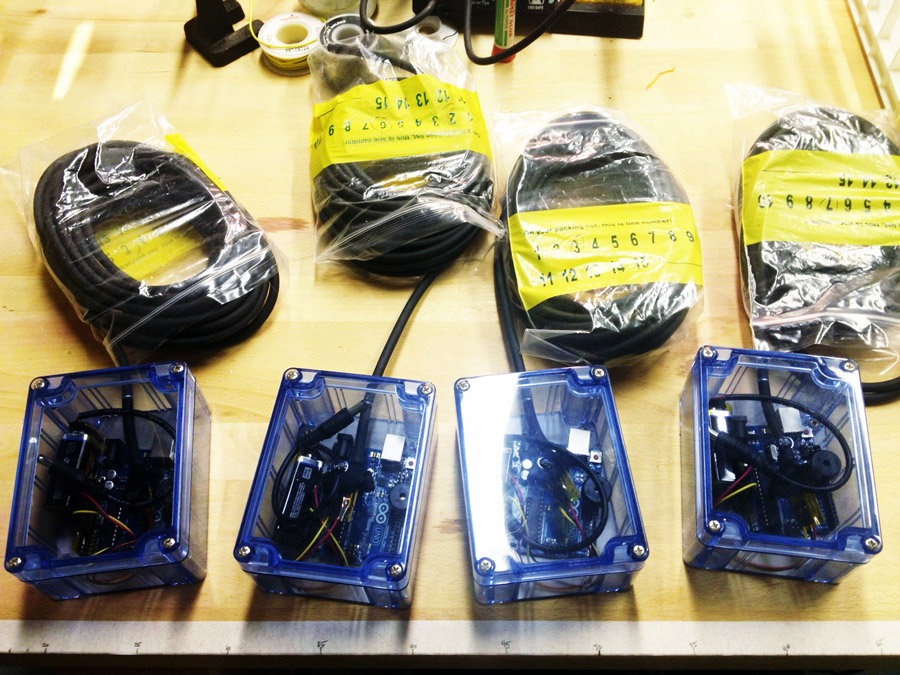 Four were built for use during the Urban Prototyping Festival in San Francisco.